As I write this post the S&P 500 is about 100 points off it’s all time high of 2922, and climbing fast. We’ve seen an incredible bull market over the last ten years since the last financial crisis, and many people are wondering whether the next crash is around the corner.
So if you’ve just come into some money that you’d like to invest, is now a good time? What if you invest everything right before the market crashes again? Should you wait?
One popular strategy used in this situation is dollar cost averaging. Rather than invest everything at once or keeping your cash on the sidelines, dollar cost averaging parses out what you’d like to invest over time. The idea is that stretching out your investing over a longer period protects your savings against crashes. Basically, if the market does crash tomorrow you have less at risk.
For example, I have a client who just sold her business last year. She’s expecting to live off the proceeds raised from the sale for the rest of her life. We have a plan in place to help her accomplish this.
One of the big psychological hurdles we had to work through was how to go about investing this cash. While my client needs portfolio growth to ensure she doesn’t run out of money, the proceeds from her business sale account for over 70% of her net worth. Investing all of it at once was a nerve wracking idea! So we decided to dollar cost average the funds over the subsequent 12 months instead.
Dollar Cost Averaging vs Lump Sum
After studying this stuff for a while, I know that my client is likely to have a better outcome by investing everything at once. But that doesn’t help her sleep at night. The idea that the years of toil in her business could be washed away in an instant by neurotic Mr. Market was unacceptable. And even though she’s more likely to leave money on the table by holding back the cash during a growth period, this route made more sense for her.
Since then I’ve had probably half a dozen clients in similar situations. They have cash, but are reluctant to put it all at risk at once. While dollar cost averaging helps, I know intuitively that we’re more likely to miss out on potential returns than successfully avoid a crash.
But how much more likely?
There have been a few studies on this subject over the years (like Vanguard’s in 2012). But with the research tools I use in my practice, I figured I’d run the analysis myself out of curiosity. Especially since market returns since 2012 have been so strong.
I should also note that I grabbed the data for this post (and began writing it) back in December. Business got in the way, and it’s taken me a couple months to finish it up. Last month Nick Maggiulli of Ritholtz Wealth wrote a great post on the same topic. Ordinarily I don’t like to write posts that are similar to others I’ve recently read, but here we are. If you’re interested in the topic you should definitely read Nick’s post.
The Data
To start, I used the Morningstar US Market Index as a proxy for stocks and the Barclays U.S. Aggregate bond index for bonds. I chose the Morningstar index because didn’t want to omit small & mid cap stocks by using the S&P 500. I pulled monthly returns going back 20 years for both indices, including dividends & distributions. 20 years isn’t a tremendously long time, but it does capture the dot com bubble & bust, the mortgage crisis, and the last 10 years of market strength we’ve enjoyed.
Then I went to work calculating the returns of a 60/40 portfolio invested all at once, versus the same portfolio invested over a 12 month period using dollar cost averaging. I ran the exercise using rolling 3 year, 5 year, and 10 year periods.
The Results
Three Year Rolling Periods
In the first “run”, I took a look at returns over rolling 3-year periods. The first month of the exercise was October of 1999. I looked at the 3-year cumulative return using the monthly returns of the 60/40 portfolio invested all at once. Then I calculated the same 3-year cumulative returns of the same portfolio, but “dollar cost averaging in” over a 12 month period.
There were 203 different 3-year rolling periods. Of those, investing all at once in a lump sum outperformed dollar cost averaging 153 times (about 75%). On top of that, the total return of investing all at once was 2.65 higher, on average.
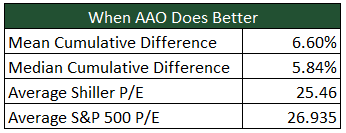
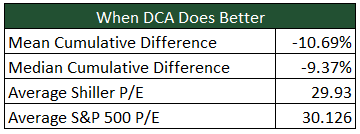
I then separated the periods where one method outperformed the other. Of the 50 periods where dollar cost averaging did outperform, it did so by about 6.24%, whereas investing all at once outperformed by 5.55% when it did better.
What was most interesting to me here is that of the 50 periods where dollar cost averaging did better, 42 (or 84%) occurred in the periods between Apr 2000 and July 2002, or June 2007 and October 2008. Both these periods preceded major market crashes, of course.
You’ll also notice that I included the average P/E ratio and Shiller P/E ratio of the S&P 500 too. Remember that the Shiller P/E is a cyclically adjusted ratio, using the market’s average earnings over the last ten years. I included these metrics because it seems logical that dollar cost averaging would work better in periods of higher P/E multiples. When the market is expensive, wouldn’t you want to invest little by little, rather than all at once? When the market is cheap, wouldn’t you want to take advantage by investing all at once?
Five Year Rolling Periods
Looking at five year rolling periods instead of three, the result was similar. There were 179 total periods over the 20 year span, and investing the 60/40 portfolio all at once outperformed in 135 of them (75.42%). What’s interesting to me about this run is that investing all at once outperformed dollar cost averaging by an average of 2.65%. This is identical to three year rolling periods above.
While the average P/E ratios are also nearly identical, the difference in returns was more extreme. In periods where dollar cost averaging does better, it did better by a wider margin over five year periods: 8.16% instead of 6.24%. When investing all at once does better, it beat dollar cost averaging by 6.6% instead of 6.24% over a three year period.
Ten Year Rolling Periods
The data from 10-year rolling periods was surprising to me at first. Dollar cost averaging fared better here than either the 3 or 5 year rolling periods, outperforming about 32% of the time.
But after looking at the 20 year time period of data, the difference becomes understandable. The whole point of dollar cost averaging is to keep some money off the table and spread risk over a longer period of time. If the market does crash after your initial investment, you have cash on hand that hasn’t lost value AND can potentially buy stocks at lower prices. And since the time period we’re viewing here is October of 1999 through October of 2018, the ten year rolling periods are book-ended by crashes. The first ten year period began right before the dot com bubble crashed. The final ten year period began in October of 2008, just as the mortgage crisis was materializing.
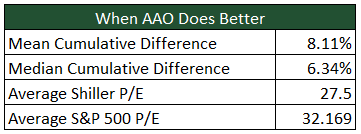
Notice the greater cumulative difference in returns here, too. In the periods where dollar cost averaging does better than lump sum investing, it does nearly 11% better on average. When investing all at once does better, it outperforms by about 8%.
Observations
So what do we get from all this? The data here is similar to what the Vanguard paper concluded in 2012: that investing a lump sum all at once outperforms dollar cost averaging about two thirds of the time. But that doesn’t mean that dollar cost averaging should be abandoned. If your primary concern is reducing downside risk (or minimizing feelings of regret if the market does take a dive), dollar cost averaging might be a good idea. You probably won’t be better off than if you’d invested everything at once, but if you’re transitioning into retirement perhaps downside risk is unacceptable to you. In this situation though, I’d suggest devising a plan that manages sequence of returns risk before moving forward with a dollar cost averaging strategy. There’s a good chance you’ll have a better outcome.
I was hoping that P/E ratios would tell us something useful too. That wasn’t the case. There’s a lot of debate around whether the P/E of the S&P 500 or the Shiller P/E ratios are indicators of future market performance. Vanguard contends (and I agree) that they are over longer time periods. Since the benefit of dollar cost averaging is reducing risk over the buy in period, which is generally no longer than 24 months, I don’t think I’d use P/E ratio when deciding whether to invest all at once. There’s just no way to tell whether a market crash is coming over a 24 month period.
What do you think? Have you employed dollar cost averaging in the past? How has it worked for you?


