When you think about your retirement & financial independence, what keeps you up at night? Is it the possibility that a market crash depletes your nest egg? Is it inflation? What about the cost of health care, or living too long and running out of money?
These are all common concerns I hear from people approaching their leap into financial independence.
Every now and then someone will ask me what they should be concerned about. “What would you be concerned about if you were in my shoes? What are my biggest risks?”
Average Returns & Volatility
Most of us approach retirement planning with expectations about the average returns we’ll see throughout retirement. You’ve probably heard (maybe even from me) that the S&P 500 averages between 7.5% and 9% in annual returns – depending on the exact data set and who you talk to. Over a 30+ year retirement, if we were to invest only in the S&P 500, we could expect an average annual return between 7.5% and 9%. I’m confident this is true, based on the last 150 or so years of historical data in the financial markets.
As you know, this doesn’t mean that the stock market will gain 7.5% each and every year. There will be years like 2001 and 2009 where the market falls 25%-30%. There will also be years where it gains 25% or more. The markets are volatile. But on average, the S&P 500 will see somewhere between 7.5% and 9% returns per year.
One of the statistical measures of volatility is called standard deviation, which is used to measure just how volatile a data set is around an average. Since 1926, the standard deviation of the S&P 500 is about 18.5%.
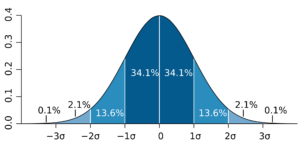
Now, the image below is something you’ve seen before. It’s a bell curve based on a normal distribution. The simple explanation of a a normal distribution is that the results occur randomly around the mean. In a normal distribution:
- 68.2% of the results will fall within one standard deviation of the mean
- 95.4% of the results will fall within two standard deviations of the mean
- 99.6% of the results will fall within three standard deviations of the mean
- 99.8% of the results will fall within four standard deviations of the mean
What does this mean for the S&P 500? If the S&P 500 is normally distributed and resembles a typical bell curve, annual returns will fall between:
- -11% and 26.5% 68.2% of the time (7.5% – 18.5% & 7.5% + 18.5%)
- -29.5% and 45% 95.4% of the time
- -48% and 63.5% 99.6% of the time
I should note that many have argued the returns of the S&P 500 are not normally distributed, including William Egan and Nassim Nicholas Taleb. And for the most part I don’t disagree with them. This argument is beside the point of this post though, so for this discussion and the following examples we’ll assume a normal distribution fits the S&P 500 just fine.
Sequence of Returns
Before you get more painful flashbacks from your college statistics course, let’s return to our retirement planning discussion. Most retirement planning is based on the premise that stock market returns will average between 7.5% and 9%.
What many people don’t take into account is the sequence in which these returns occur. Even though I may be confident that the market will return 7.5% per year on average for the next 30 years, I don’t pretend to have any idea which years it will be up and which years it will be down. (And side note, anyone who claims they do is either lying or foolish).
This, my friends, is one of the biggest risks to financial independence. Not the risk that the markets crash – we know they will from time to time. The real risk is that the very worst returns you’ll see throughout your retirement occur in the early years.
Let’s look at a few examples to learn why:
When we plan for financial independence, there are a number of issues we need to address. Mostly, we need to make sure that our nest egg is big enough to cover our living expenses. If it’s not, we’ll deplete it too quickly and run out money.
There are a number of ways to do this, but most start by creating an annual budget. We can then figure out how much of your nest egg your annual spending needs constitute. Based on the 4% rule, if your annual budget is under 4% of your nest egg you should be in great shape. If it’s higher than 4% you might need to reevaluate.
So let’s assume that you’re 60 years old, you have $1,000,000 saved up, and you want to retire. If we use the 4% rule, you’ll have $40,000 in your first year of retirement to play around with, plus whatever you get from Social Security. Assuming that’s somewhere between $15,000 and $25,000, you should have a healthy budget to work with in year 1. Of course, by using the 4% rule the amount you’ll withdraw from your account will fluctuate based on performance.
Scenario 1: Consistent Returns
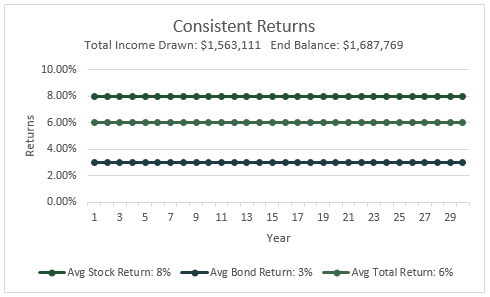
Let’s look closer at a few different return scenarios. In the first, let’s assume that you invest your retirement funds in a portfolio of 60% stocks and 40% bonds. Let’s also assume that your average return is 8% on stocks, 3% on bonds, and that you see these returns consistently every single year. This would make your net return 6% year in and year out.
Here’s what it’d look like:
In sum, your income would increase steadily each year (remember, you withdraw 4% of your portfolio balance every single year). You’d start with $1,000,000, have a total income over the 30 years of $1,563,111, and end up with a balance of $1,687,769.
But as we know, this scenario does not accurately represent reality. If we know anything, it’s that the markets will NOT produce consistent returns every single year. Some years they’ll do great, other years they’ll lose ground – sometimes a lot of ground. Scenario #1 assumes that stocks and bonds have standard deviations of 0, as the returns do not change throughout the 30 year period. We know this is not true.
Scenario #2: Alternating Returns
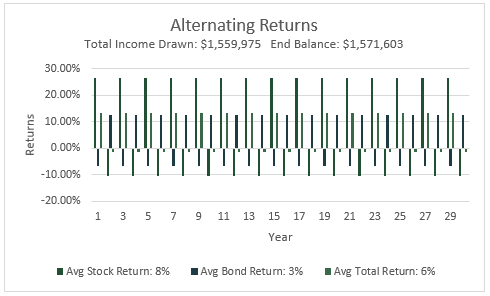
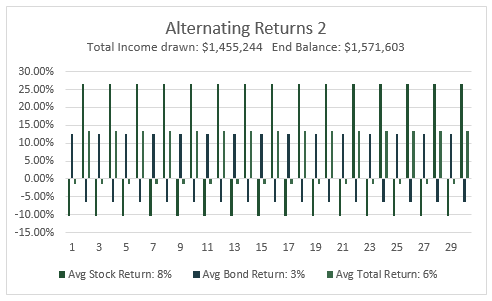
Let’s see what happens when we incorporate accurate standard deviations into the simulation, and alternate between good years and bad years. In this scenario stock returns alternate between 26.5% and -10.5% over the 30 year period. The average return remains 8% per year, and the standard deviation is accurate at 18.5. Bond returns alternate between -6.5% and 12.5%, which is also more accurate (the long term standard deviation in the bond market is approximately 9.5%).
Additionally, good years in the stock market are normally paired with bad years in the bond market, and vice versa. This scenario will take that into account. In year 1 stocks will return 26.5%, and bonds -6.5%. They’ll then alternate every year throughout the course of a 30 year retirement period.
As we can see, the higher volatility produces a worse outcome. When we compare Scenario #1 to Scenario #2, the total income drawn and ending balances of Scenario #1 are higher. In other words, less volatility is preferable to more volatility.
[Click here to download Above the Canopy’s Retirement Readiness Checklist]
Scenario #3: Alternating Returns 2.0
In Scenario #2, we started with a good year for stocks and a poor year for bonds in year 1. This made the portfolio’s net return positive in year 1, negative in year 2, and so on. But what if the situation were reversed, and we began with a poor year for stocks and a good year for bonds?
Surprisingly, when year one is bad for stocks but good for bonds, the end balance after 30 years is exactly the same. But, the total income drawn is $104,731 lower. This is 6.7% less than if year one had been good for stocks and bad for bonds.
The average returns over the 30 years are exactly the same, as is the standard deviation for both asset classes. The only difference is the sequence of the returns.
This brings us to crux of this post: the sequence of returns is a big risk to your financial independence.
Scenario #4: Declining Returns
Let’s take this idea further by looking at two extreme examples. Again, we’re going to assume that stocks and bonds return 8% and 3% on average, and their standard deviations remain 18.5 and 9.5.
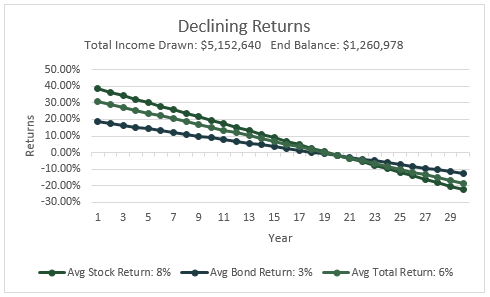
But instead of the alternating returns we examined earlier, let’s consider what happens to our outcome if our returns start very high, but decrease steadily over the 30 year period.
As you can see, this drastically changes the outcome. By front loading all the good returns in the beginning of the 30 year period, the total income drawn jumps to a staggering $5.2 million.
Scenario #5: Increasing Returns
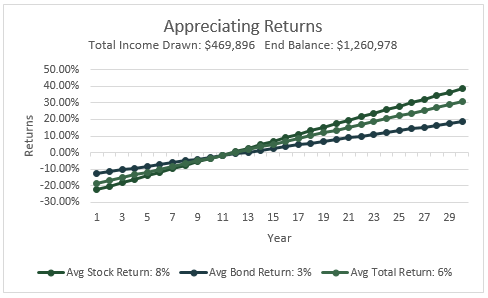
And what if the situation were reversed? What if a retiree experienced terrible returns immediately after declaring financial independence, which steadily increased over time?
Their ending balance actually remains exactly the same as in the decreasing scenario, at $1.26 million. But the total income drawn falls over 90%, all the way to $469,896. For comparison, in the first five years of the decreasing returns (or “good”) scenario, you would draw $318,981.81 in income, or $63,796.36 per year. In the first five years of the “bad” scenario, you’d only draw $133,485.50 – $26,697.10 per year.
And this highlights the most important foundation of sequence of returns: They greatly affect the total income you’ll draw throughout retirement.
Summary
Here’s a recap of the scenarios above:
When we compare them, we can draw two conclusions:
- Less volatility is preferable to more
- Higher returns are preferable earlier in retirement as opposed to later
How Do You Protect Your Financial Independence?
All in all, a 30 year retirement period is quite a long time. Long enough that we can be confident a retiree will see the full array of market returns over time, and their average will converge to the long term average between 7.5% and 9%.
But when it comes to guarding against an unfortunate sequence of returns, let’s remember that the 4% rule was designed to incorporate the very worst retirement periods in history. Even if a retiree is extremely unlucky and sees their worst returns earlier on, the 4% rule will still work.
In sum, if you’re wondering what should concern you about retirement, I would not focus on market calamities. Over a 30 year retirement you can be confident you’ll see a few of them.
Instead, the timing of those calamities will have a bigger impact on your retirement income. And while they’re unfortunately out of our control, sticking to a 4% withdrawal rule gives you a very high probability of never running out of money.
Save

